Navigation
Explanation and tutorials
1. Drug transporters and inhibitor/substrate
Drug transporters are a subset of membrane transporters that are widely distributed throughout various tissues and organs, including the liver, kidney, small intestine, brain, placenta, and other systemic regions. They can be classified into two main superfamilies: ATP-binding cassette (ABC) transporters and solute carrier (SLC) transporters. SLC transporters primarily facilitate the cellular uptake of drugs through processes such as diffusion or ion-coupled secondary active transport. Examples of SLC transporters include organic anion transporting polypeptides (OATPs) from the SLC21/SLCO gene family, organic cation transporters (OCTs) from the SLC22A gene family, organic anion transporters (OATs), and multidrug/toxin efflux transporters (MATEs) from the SLC47A gene family. On the other hand, ABC transporters play a crucial role as active efflux transporters, utilizing ATP hydrolysis to transport drug substrates, including P-glycoprotein (P-gp, ABCB1), multidrug resistance-associated protein (MRP, encoded by the ABCC gene), breast Cancer resistance protein (BCRP, ABCG2), and bile salt export pump (BSEP, encoded by the ABCB11 gene), etc.
When a substrate binds to the transporter, it undergoes transportation across the membrane. This transport mechanism is commonly referred to as the "alternating-access model." Molecular studies have identified three main types of models that describe the alternating-access mechanism: the "rocker-switch," the "rocking-bundle," and the "elevator" mechanisms. On the other hand, an inhibitor is a molecule that also binds to the transporter but impedes its activity, thereby reducing or interrupting substrate transport. Inhibitors can be reversible or irreversible. The effectiveness of both transport and inhibition is influenced by the affinity between the transporter and its substrate. Various in vivo and in vitro parameters are employed to evaluate efficiency, such as AUC (Area under the plasma drug concentration-time curve), Cmax (Maximum concentration), efflux ratios (ERs), Km (the Michaelis constant), Vmax (Maximal Velocity), and Ki (inhibitor constant). Km and Ki are widely used measures; Km represents the substrate concentration at which the enzyme achieves half Vmax and is inversely related to affinity, while Ki indicates the potency of an inhibitor by representing the concentration needed for half maximum inhibition. In vivo parameters are derived from clinical trials or animal studies. To study uptake and efflux transport kinetics and obtain these parameters, three common types of in vitro systems are employed: (i) expression systems, using immortalized cell lines (e.g., CHO, HEK, HeLa, LLC-PK1, and MDCKII), oocytes, or vesicles; (ii) whole cells, including primary or cultured cells (e.g., hepatocytes) and derived cell lines (e.g., Caco-2, HepG2); and (iii) vesicles derived from cell lines or whole cells. Expression systems are directly utilized to estimate kinetic/inhibition parameters for overexpressed transporters, while cellular systems can be optimized to estimate specific kinetic parameters related to uptake, metabolism, efflux, or the interplay of multiple processes.
The potential drug-drug interactions mediated by ATP-binding cassette (ABC) transporters and solute carrier (SLC) family pose clinical and regulatory concerns. Simultaneously, the interaction between endogenous substances such as metabolites, antioxidants, signaling molecules, hormones, nutrients, and neurotransmitters with drug transporters may contribute to larger long-distance communication systems ("remote sensing and signaling") within cells, organs, interstitial fluids, or even between independent organisms. Therefore, the identification and summary of ligands (inhibitors and substrates) that interact with drug transporters, including drugs and endogenous substances, hold significant importance for drug development, regulation, clinical application, and exploration of the physiological functions of drug transporters.
2. Inhibitor and substrate of transporters Database (ISTransbase)
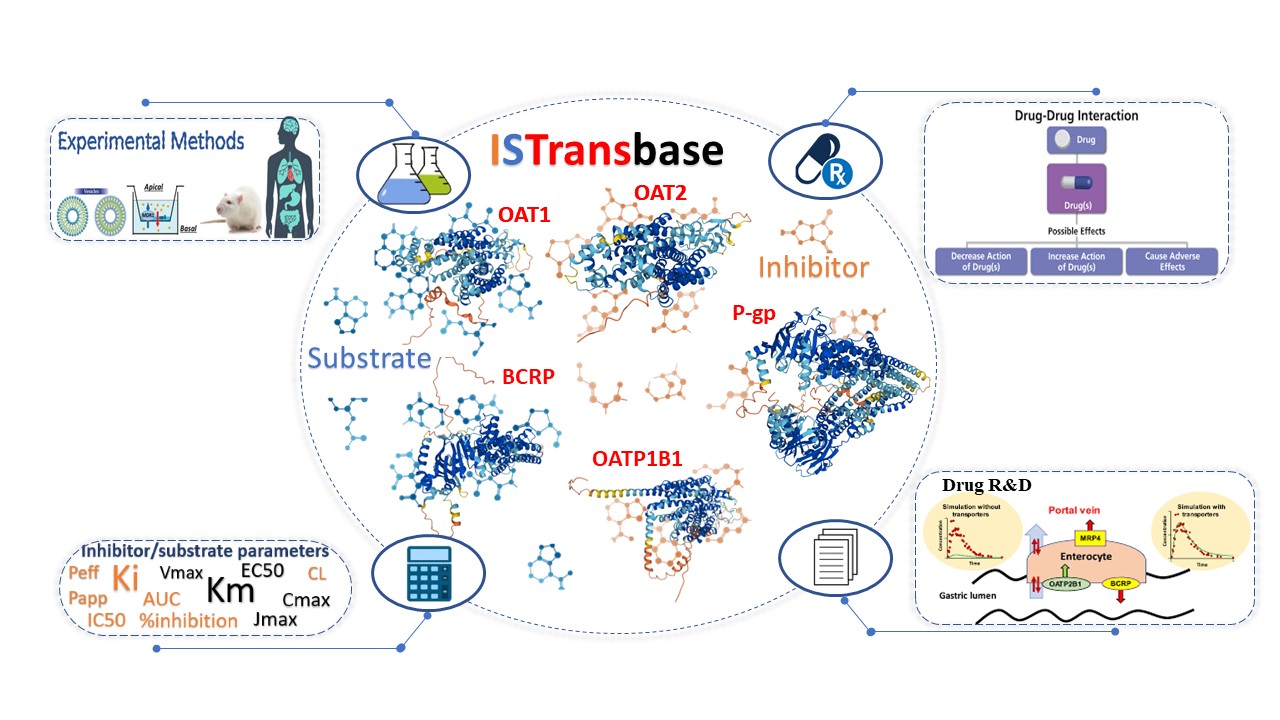
Figure 1. Overview of the ISTransbase
2.1 Overview
ISTransbase is a comprehensive database that provides valuable information on transporter inhibitors and substrates. It covers 163 drug transporters from 18 different species, with 17 belonging to the ABC transporter family (including MDR1, BCRP, BSEP, and MRPs) and 132 belonging to the SLC transporter family (such as OATPs, OAT1/2/3/4, OCT1/2/3, and NTCP). Additionally, ISTransbase incorporates data on other transporters like AQP7 and MTP. Users can search for transporters associated with drugs or drug-like compounds and access essential information about these transporters, including their names, coding genes, structure, function, location in the body, related diseases, significant polymorphisms, and government policy information from regulatory bodies like FDA, EMA, and PDMA.
Within ISTransbase, a vast collection of 16,528 inhibitors and 4,465 substrates of drug transporters has been compiled, resulting in 117,591 entries on inhibitors and 67,135 entries on substrates (Statistics 01). In terms of inhibitor and substrate classification by drug transporters, MDR1 is the most abundant transporter for inhibitors, followed by OATP1B1, OATP1B3, BCRP, BSEP, and others. Similarly, MDR1 also accounts for the largest proportion of substrates, followed by BCRP, OCT1, MRP2, and OATP1B1 (Statistics 02). ISTransbase also provides detailed information on experimental methodologies used in vivo and in vitro, as well as various transport parameters. Notably, in vitro data appears to be more abundant for inhibitors and substrates compared to in vivo data. In substrate and inhibitor research, cell lines are the most commonly utilized method (71% and 76% respectively), followed by membrane vesicles, oocytes, and primary cells (Statistics 03,04). The results obtained from these experiments, including transport parameters, inhibition parameters, or qualitative findings, are also documented within ISTransbase. The five most frequently observed in vitro inhibition parameters are IC50 (39%), %inhibition (21%), Ki (9%), transport change (8%), and EC50 (4%). Meanwhile, the most common substrate parameters include Papp (29%), transport ratio (18%), Km (11%), and drug transport (6%) (Statistics 05,07). In vivo, the highest proportion of inhibitor and substrate parameters includes AUC (area under the concentration-time profile), Cmax (maximum concentration), CL (clearance), and 'Concentration' (Statistics 06,08).
ISTransbase serves as a valuable resource for researchers and professionals in the field, offering extensive information on transporter inhibitors, substrates, experimental methodologies, and transport parameters in both in vivo and in vitro settings.
2.2 Data searching
ISTransbase offers three distinct modes for searching data, as depicted in Figure 2. The first mode is called Drug2Transporters, allowing users to search for transporters by entering drug information, either in the form of SMILES notation or the drug's name, within a designated list box. The second mode, Transporter2Drugs, enables users to search for substrates and inhibitors associated with a specific target drug transporter. Users can select the desired transporter from a drop-down list box and further refine the search by adding additional constraints such as substrate/transporter, in vivo/in vitro, species, research methods, and transport parameters simultaneously. Lastly, users can input both the transporter and the compound to explore the relationship between them, gaining access to detailed information on experimental conditions and results. After entering the necessary information, users can click on the 'Submit' button, which will direct them to the query results page for further examination.
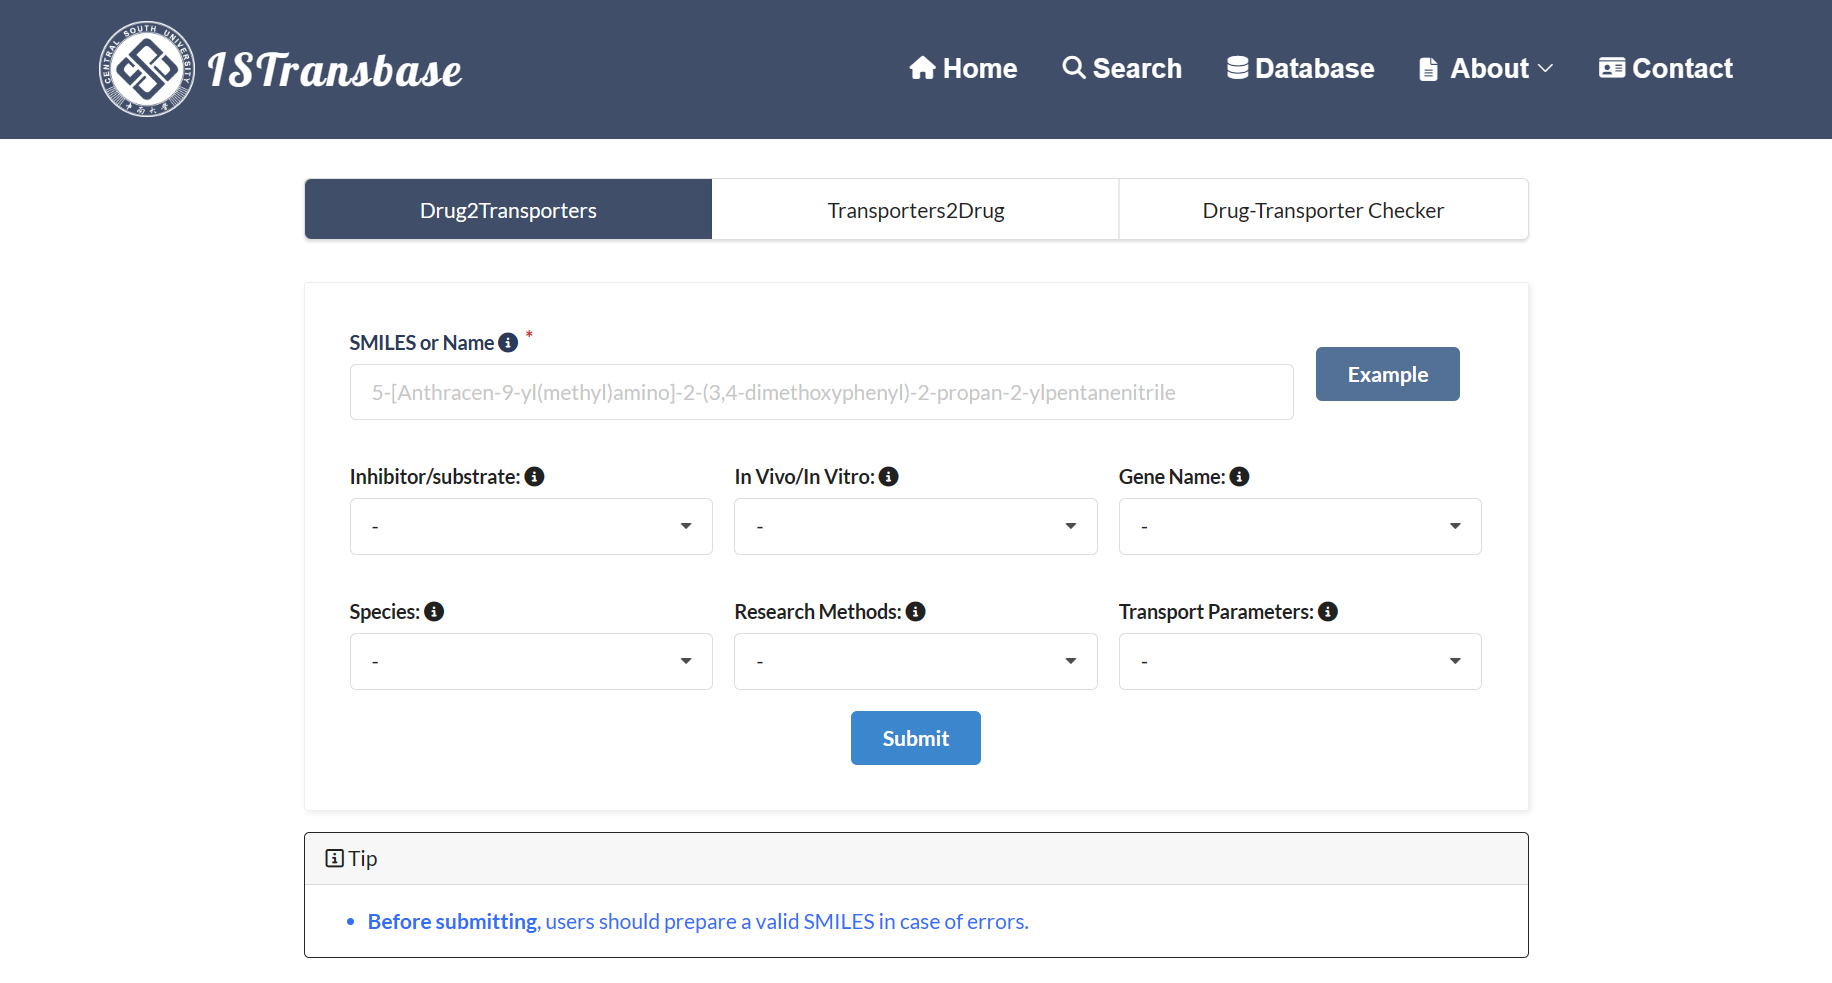
Figure 2. The main search page of ISTransbase
When users search for transporters based on molecular information such as SMILES or Name, the searched molecule's structure is displayed in the upper left corner of the interface. On the right side of the interface, a table presents transporter names along with a "View" button for each specific interaction. Clicking the "View" button allows real-time visualization of the transporter structure from different perspectives. The table also provides links to the corresponding transporter protein entry in the UniProt database, information on ligand types (inhibitor/substrate), method types (in vitro/in vivo), and the species involved. Additionally, the table may include hyperlinks that lead to other relevant details.
Simultaneously, statistical results of the search are presented on the left side, including classifications of drug transporters and species (Figure 3). If users wish to explore more detailed information about a specific transporter, they can click on the transporter ID within the results data sheet. This action will redirect them to the transporter page, which offers a summary of essential information about the transporter. This includes details such as coding genes, structure, function, location in the body, associated diseases, significant polymorphisms, and government policy information from regulatory bodies like FDA, EMA, and PDMA (Figure 4).
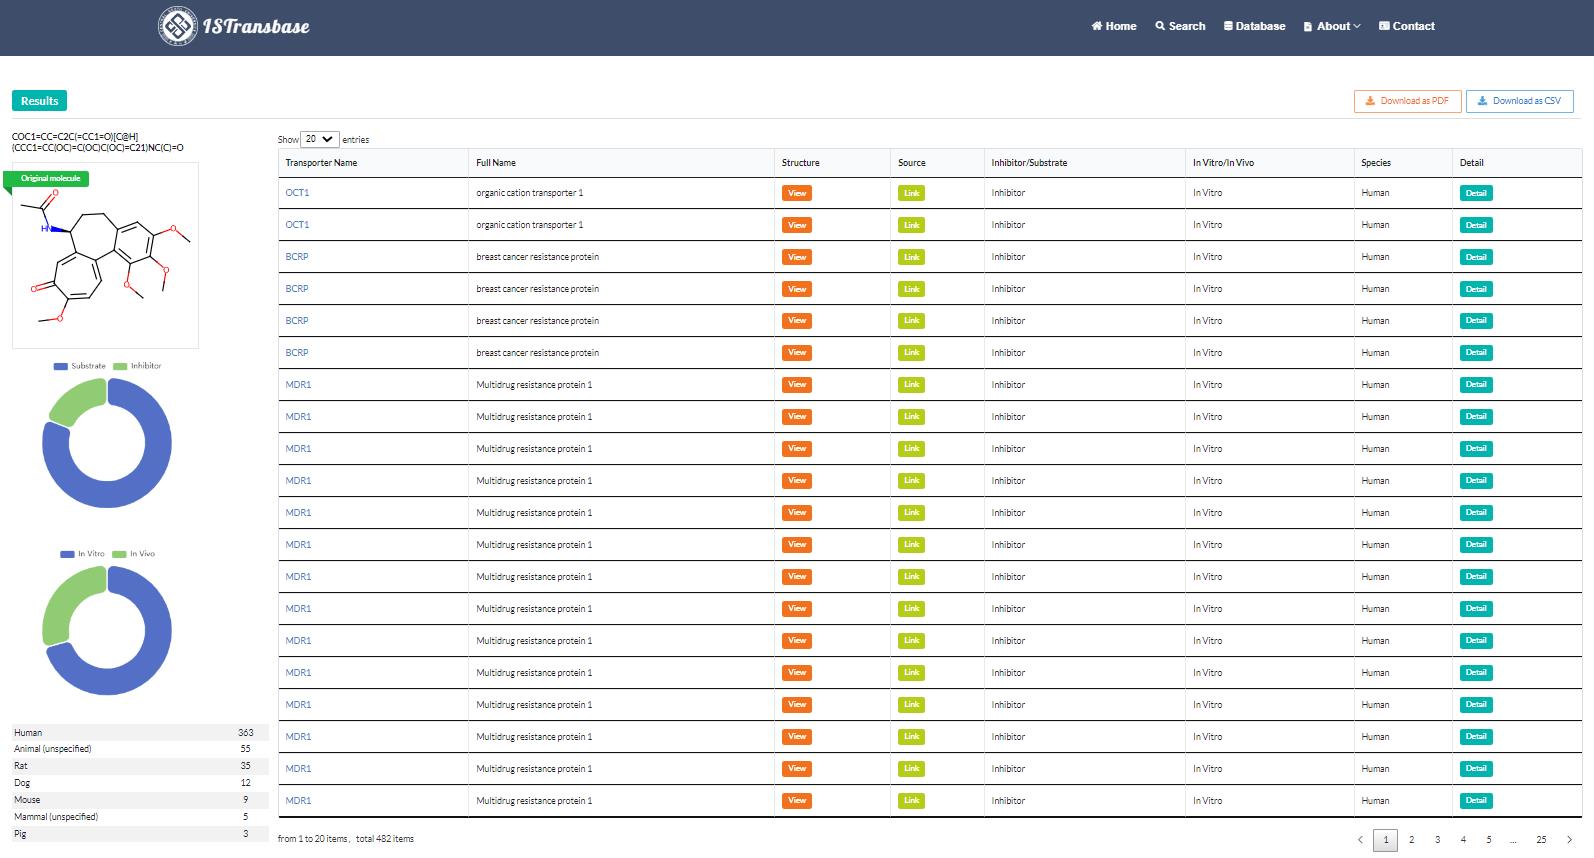
Figure 3. Search results of drug2transporters model (Colchicine: COC1=CC=C2C(=CC1=O)[C@H](CCC1=CC(OC)=C(OC)C(OC)=C21)NC(C)=O)
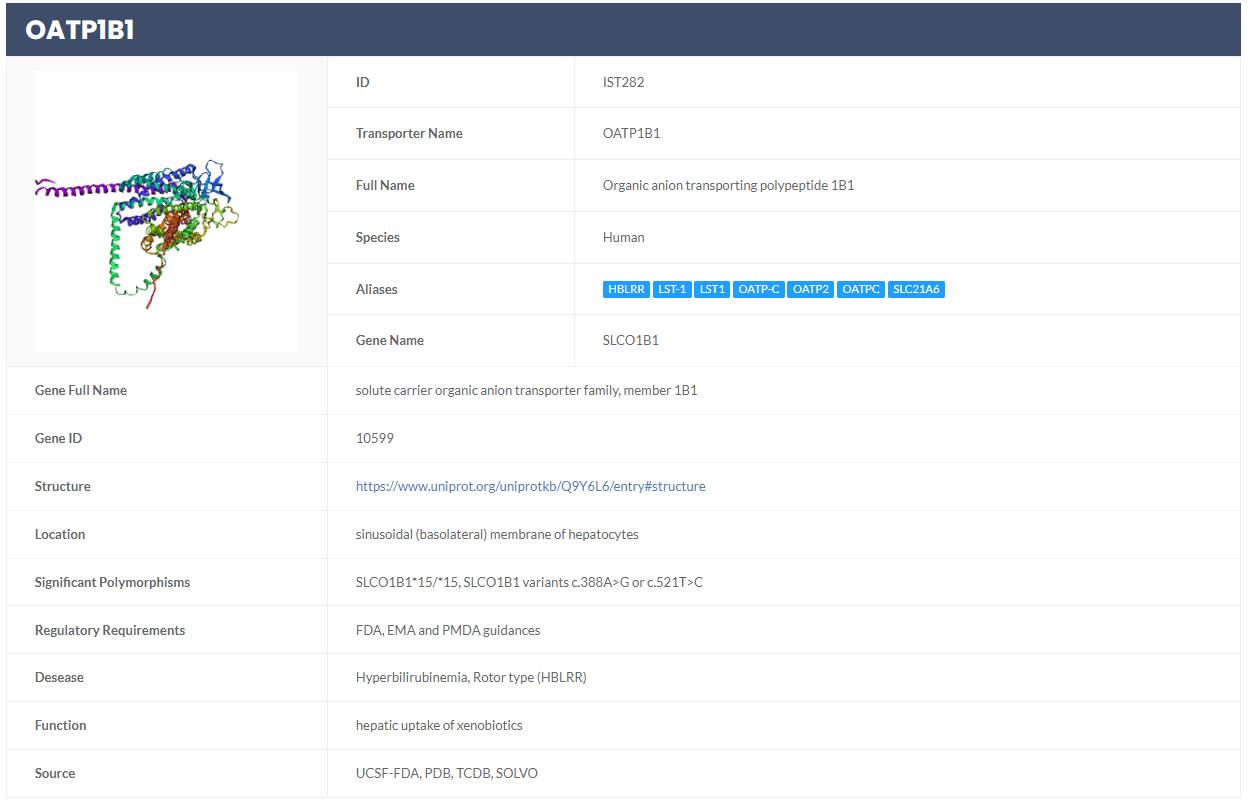
Figure 4. Page with detailed information on drug transporters (OATP1B1)
By clicking on the hyperlink in the "Detail" column, users will be directed to a comprehensive information page divided into three sections: overview, experiment information, and drug properties (Figure 5). The "Overview" tab presents the queried drug, the interacting transporter, whether it acts as an inhibitor or substrate, and whether the interaction is observed in vitro or in vivo. ISTransbase provides crucial information about the research method, including the experimental system employed (cell type, tissue, or animal) and specific experimental conditions such as dose and time. Additionally, experimental results are available, encompassing inhibitor-related parameters (such as Ki or %inhibition), substrate-related parameters (such as Km or %transported), and in vivo parameters (such as AUC or Cmax). The table indicates the source of the data for reference. Furthermore, within the drug properties tab, we have integrated our previous online platform, ADMETlab 2.0, enabling the prediction of ADMET properties of the drug.
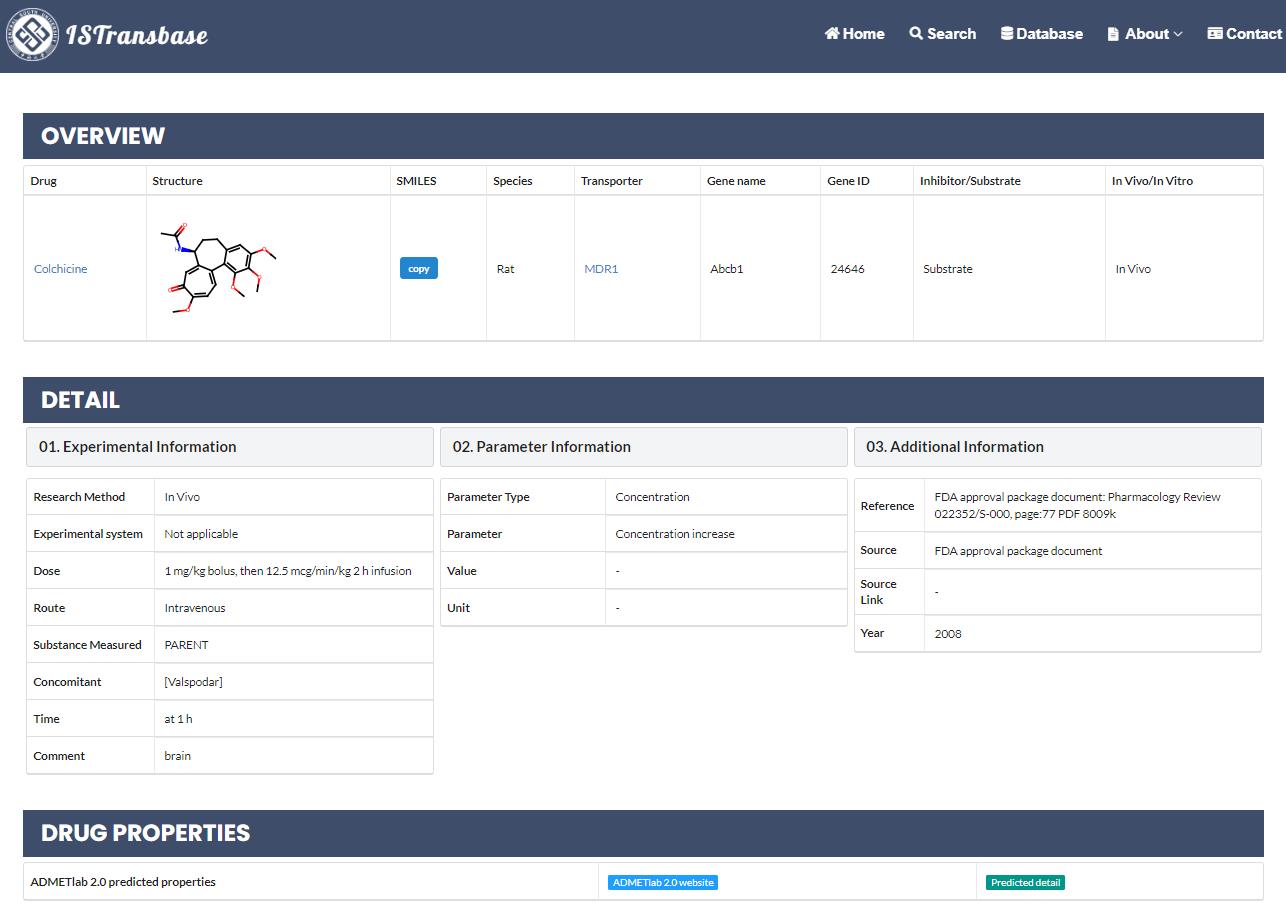
Figure 5. Detail page of search results
When searching for substrates or inhibitors of a specific transporter (protein name, gene name, or gene ID), the search results interface provides valuable information. The structure of the searched transporter is presented in the upper left corner, while the table on the right side displays the molecular structure, name, SMILES notation, and information regarding in vitro/in vivo research (Figure 6). It also includes details about the species of transporters and provides hyperlinks for accessing additional information. Simultaneously, the left side of the interface presents statistical results derived from the search, offering insights into the distribution of molecular species and their occurrences, as well as the distribution of inhibitors and substrates. Furthermore, the distribution of in vivo and in vitro research methods is also provided, allowing users to gain a comprehensive understanding of the available data.
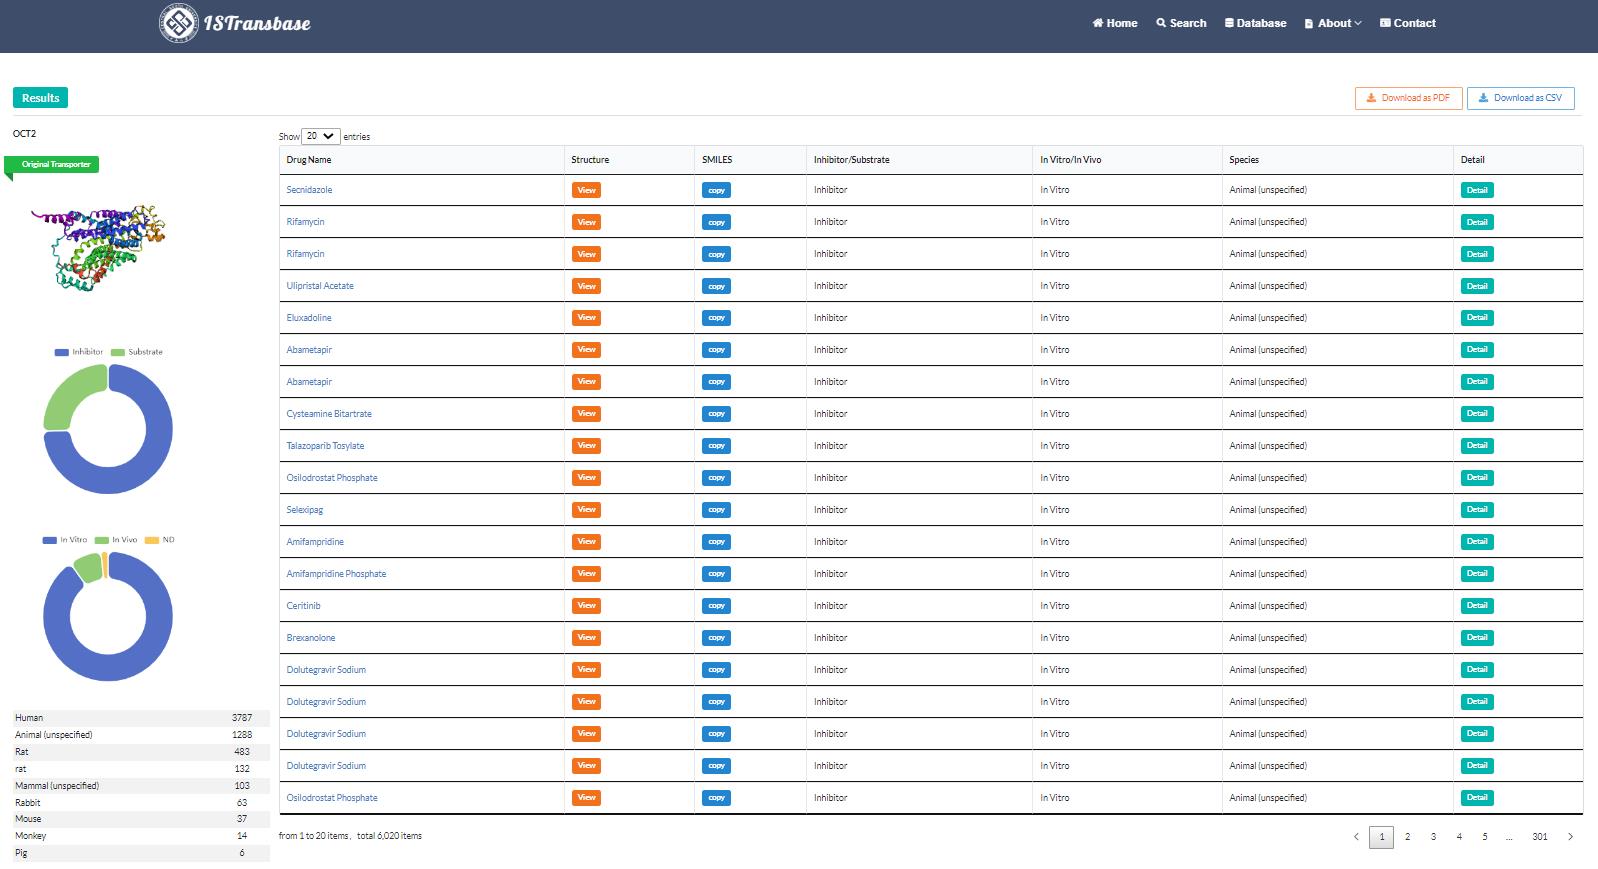
Figure 6. Search result of transporter2drug model (OCT2)
2.3 Data browsing and downloads
The browsing tool in ISTransbase efficiently presents summarized data by linking the drug name to Drugbank, the transporter name to the transporter page, the corresponding gene, ligand type (inhibitor/substrate), method type (in vitro/in vivo), research methods, and a "Detail" button (Figure 7). To assist users in refining their searches, ISTransbase provides convenient filtering options that allow for the selection of multiple criteria, including ligand type (inhibitor/substrate), method type (in vitro/in vivo), species, experimental system type, or parameter type. Additionally, above the search results, users will find links to download the obtained data in CVS format. ISTransbase offers the flexibility to download all transporters, inhibitors, and substrates from the website without the need for login or registration.
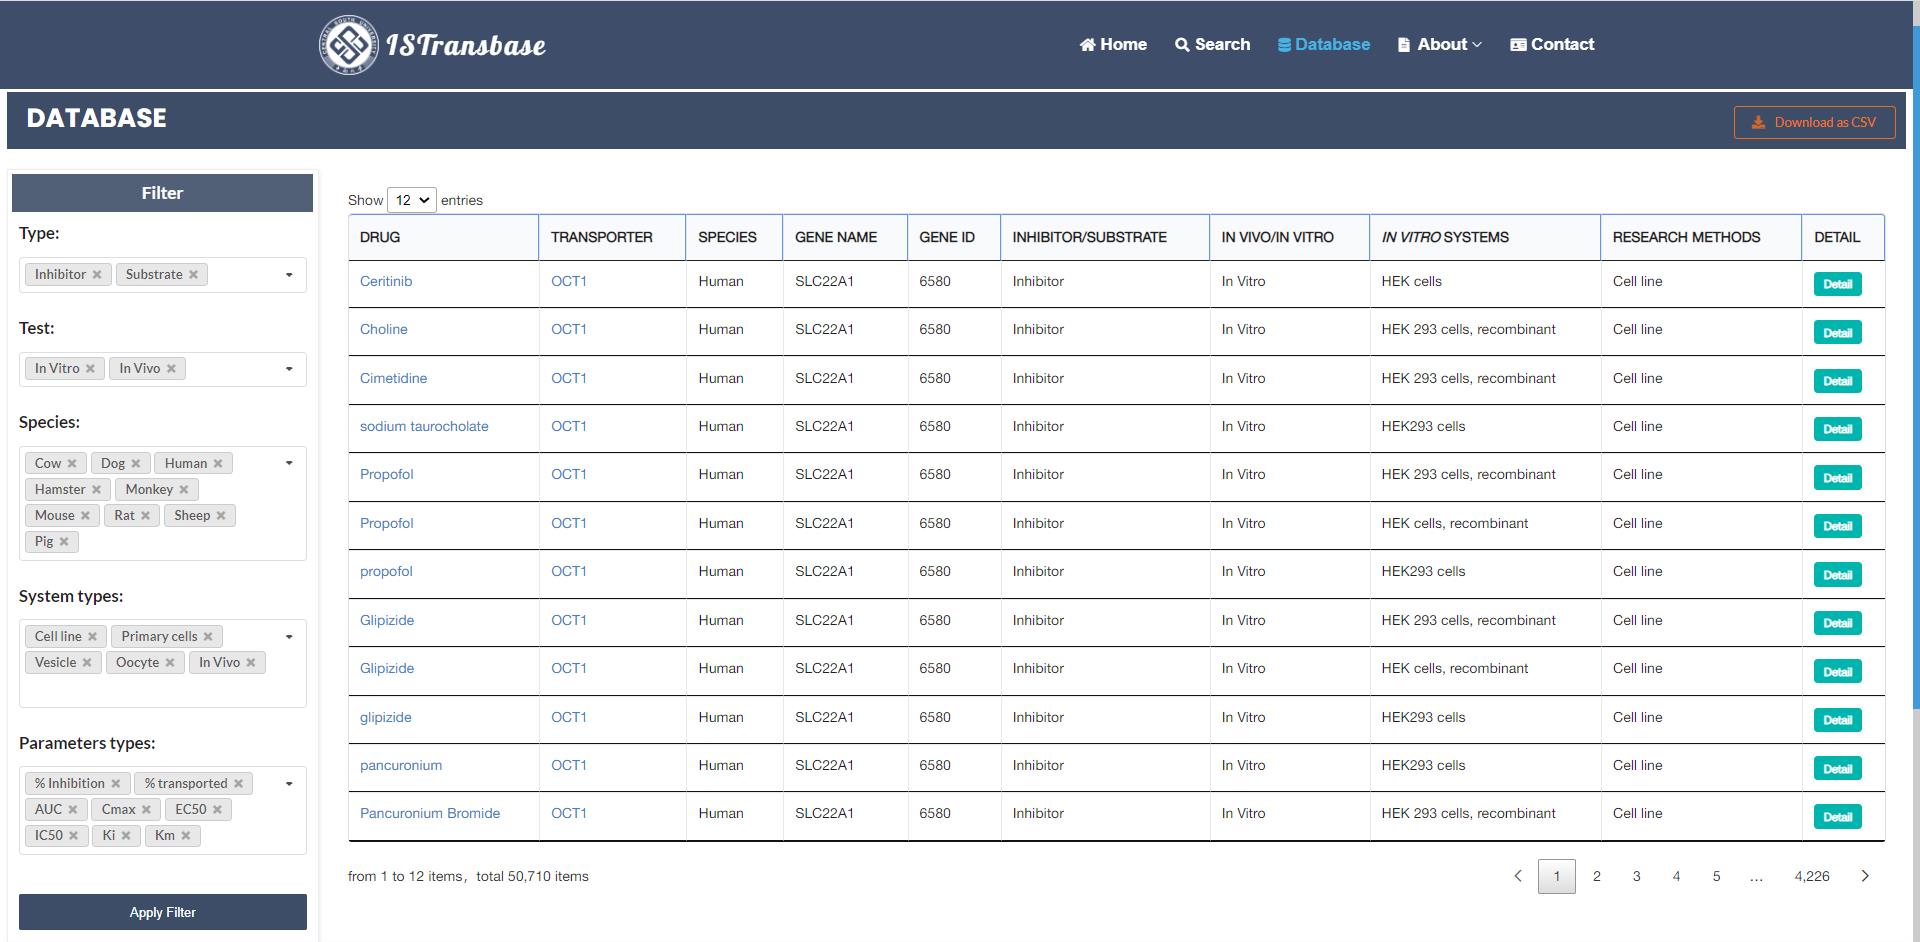
Figure 7. Data browsing and download page
3. Abbreviation
| Abbreviation | Definition |
|---|---|
| % Inhibition | Inhibition percentage of inhibitor |
| % transported | Transport percentage of transporter |
| 1/RI50 | The RI50 values were determined as the concentration of inhibitor that causes a twofold reduction of the IC50 in each transfectant. 1/RI50 is the reciprocal value of RI50, was used to show the extent of drug resistance reversal of the compounds. |
| Alpha max | Maximum increase that can be obtained in the nuclear concentration of pirarubicin in resistant cells; a value varies between 0 (in the absence of the modulator) and 1 (when the amount of pirarubicin in resistant cells is the same as in sensitive cells). |
| AUC | Area under the plasma drug concentration-time curve |
| C/M | Cell to medium ratio |
| Cavg | Average concentration |
| CL | Clearance |
| Cmax | Maximum concentration |
| Cmin | Minimum concentration |
| EC200 | Concentration of inhibitor that increase the uptake of substrate to 200% |
| EC50 | Half maximal effective concentration |
| ED50 | Median effective dose |
| Emax | Maximum effect of inhibitor |
| f2 | Concentration needed to double baseline fluorescence |
| FC | Fold change in IC50 or resistance reduction or permeability..., etc. relative to control |
| F | Bioavailability |
| Fg | Intestinal availability |
| Fh | Hepatic availability |
| Clint | Intrinsic clearance |
| CLnr | Non-renal clearance |
| CLpl | Plasma clearance |
| CLr | Renal clearance |
| CLt | Total clearance |
| FICI | Fractional Inhibitory Concentration Index |
| JAB, JBA | Apical to basolateral flux, basolateral to apical flux |
| Jmax | Maximal rate of mediated substrate transport |
| Jnet | Net flux |
| ft | Fraction of drug transported |
| GI50 | The dose that inhibits the growth of cells by 50% |
| I0.5 | the potency of the inhibitor and represents the concentration that causes a half-maximal increase (R = 0.5) in the nuclear concentration of pirarubicin |
| IC20 | Drug dose causing 20% inhibition of drug transport or cell growth |
| IC25 | Drug dose causing 25% inhibition of drug transport or cell growth |
| IC50 | Drug dose causing 50% inhibition of drug transport or cell growth |
| IC90 | Drug dose causing 90% inhibition of drug transport or cell growth |
| Imax | Maximum uptake rate |
| Ka | Absorption rate constant |
| Kact | Concentration of activator required for 50% maximal activity |
| Kd | Dissociation constant |
| Kel | Elimination rate constant |
| Ki | Inhibition constant |
| Km | Michaelis constant |
| Kp | Equilibrium constant |
| mRNA | Messenger RNA |
| MRT | Mean Residence Time |
| Papp | Apparent permeability |
| Pc | Carrier-mediated permeability |
| Pdif | Nonsaturable uptake clearance (l/min/mg protein) |
| Peff | Effective permeability |
| PK | Pharmacokinetics |
| PSeff | Efflux clearance |
| PSinf | Influx clearance |
| T1/2 | Half-life |
| Tmax | Time to maximum plasma concentration |
| Vd | Volume of distribution |
| Vmax | Maximum velocity |
| Vz | Volume of distribution at pseudo-distribution equilibrium |